
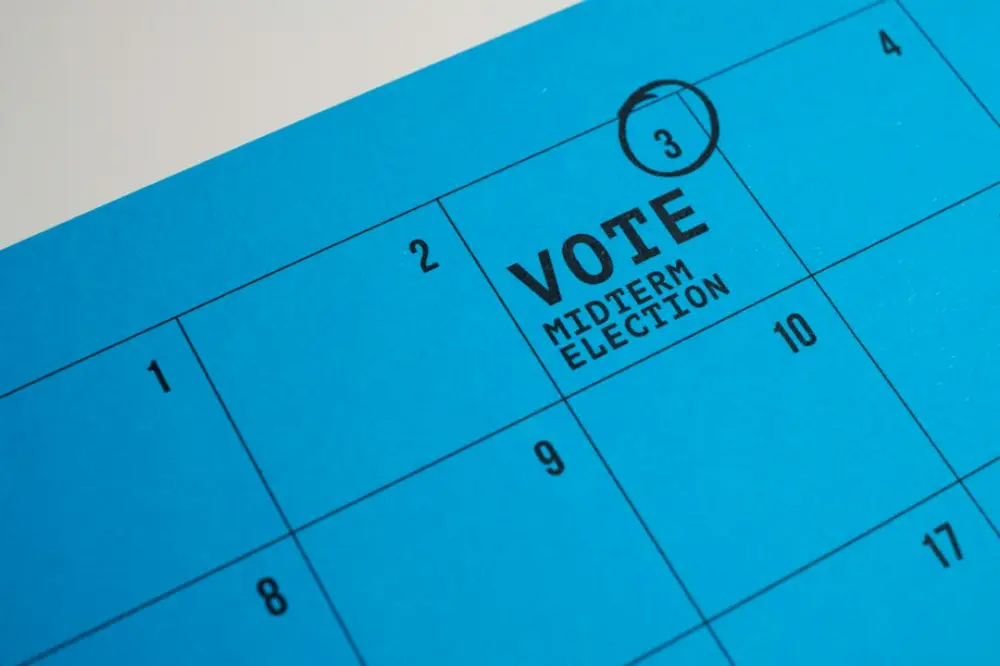
Election cycle forecasting is a statistical method used to predict the results of upcoming political contests, such as the 2026 US Midterms. By combining historical trends, economic indicators, and real-time polling data, these models provide a probabilistic outlook on which party will likely control the House and Senate after the election.
With the November 3, 2026, vote less than two weeks away, these forecasts serve as a tool for managing uncertainty. Rather than looking at a single snapshot of public opinion, forecasting models synthesize thousands of data points to help observers understand the likely composition of the 120th Congress and the specific pressures facing incumbent candidates.
What is Election Cycle Forecasting?
Forecasting is distinct from simple polling. While a poll asks a specific group of people how they intend to vote on a specific day, a forecast attempts to predict the final outcome by accounting for variables that haven't happened yet or that polling might miss. In the context of the 2026 midterms, this involves calculating the probability of various outcomes, such as a narrow Republican majority in the House or a Democratic hold on the Senate.
Most modern models use a Bayesian approach. This means they start with a "prior"—a baseline expectation based on historical patterns—and then update that expectation as new data, like fresh polling from Pennsylvania or Nevada, becomes available. For example, a forecaster might start with the historical fact that the president’s party almost always loses seats in a midterm. They then adjust this baseline based on current inflation rates, presidential approval scores, and the quality of individual candidates running in swing districts.
The output of these models is rarely a binary "win" or "loss" prediction. Instead, they produce a range of outcomes. A model might state that there is a 70% chance of the GOP winning the House, which simultaneously acknowledges a 30% chance that Democrats retain control. This probabilistic thinking is essential for avoiding the surprise many felt during previous cycles where "unlikely" events occurred. In 2026, forecasters are particularly focused on the high number of competitive seats in the Sun Belt and the Rust Belt, where small shifts in turnout can swing the entire model.
Structural Models vs. Polling Data
Forecasters generally rely on two different types of data: structural fundamentals and direct polling. Structural models look at the underlying conditions of the country. These include the "Midterm Penalty," which has seen the incumbent president's party lose House seats in nearly every midterm since the Civil War. Other structural factors include the national unemployment rate, consumer confidence indices, and whether the country is currently involved in a major foreign conflict.
Polling data, conversely, captures the immediate mood of the electorate. In 2026, we see a heavy reliance on the "Generic Congressional Ballot," which asks voters which party they would prefer to see in control of Congress without naming specific candidates. While structural models might suggest a difficult year for the party in power, strong polling in specific suburban districts might suggest that local issues—such as reproductive rights or local infrastructure projects—are outweighing national trends. We find that neutral information design improves trust and clarity when comparing these disparate data sources.
The challenge for 2026 forecasters is weighting these two inputs. Early in the cycle, structural models are more predictive because polling is sparse and name recognition for challengers is low. As we reach late October, polling takes a larger share of the weight in the model. However, after the polling errors seen in the early 2020s, many forecasters now "de-bias" their data by looking at the track record of specific pollsters and adjusting for "herding," where pollsters produce results that look similar to their competitors to avoid being outliers.
Prediction Markets and Alternative Methods
Beyond traditional statistical modeling, many observers now look to prediction markets and qualitative expert analysis. Prediction markets, such as PredictIt or Polymarket, allow users to trade shares on the outcome of elections. The "price" of a share reflects the market's collective estimate of an event's probability. For instance, if a share for "Republicans to win the Senate" is trading at 65 cents, the market believes there is a 65% chance of that outcome.
The advantage of these markets is their ability to react instantly to news. If a major candidate has a poor debate performance or a significant economic report is released on a Friday morning, market prices move faster than a poll can be fielded and processed. However, these markets can also be prone to volatility and "noise," reflecting the biases of the traders rather than the broader electorate. They are a useful supplement to, but not a replacement for, rigorous demographic modeling.
Qualitative analysis remains a third pillar. Organizations like the Cook Political Report or Sabato’s Crystal Ball categorize races as "Solid," "Likely," "Lean," or "Toss-up." These experts look at factors that numbers might miss, such as a candidate's fundraising prowess, their personal scandal history, or internal party friction. In the 2026 cycle, qualitative shifts in "toss-up" districts in states like California and New York have been pivotal in determining which party has the momentum heading into the final weekend of the campaign.
Analyzing State and District Outcomes
The 2026 midterms are not one national election, but a collection of 435 House races and 33 Senate contests. Forecasting at the state and district level requires a more granular approach than national modeling. For the Senate, models must account for the specific "map"—which seats are up for election and in which states. A party might be popular nationally but face a difficult Senate map if they are defending seats in states that trend toward the opposition.
In the House, the focus is on "swing districts" identified through redistricting data and past presidential vote margins. A concrete example in 2026 is the focus on the "suburban pivot" districts—areas outside cities like Phoenix, Atlanta, and Philadelphia. Forecasters use "multilevel regression with post-stratification" (MRP) to estimate how specific demographic groups (e.g., college-educated women or rural voters under 30) are likely to vote in a specific district based on national trends. Ultimately, the way we present election data determines whether a voter sees a definitive trend or a statistical dead heat in these critical areas.
Voter turnout models are the final, and perhaps most difficult, piece of the puzzle. Midterm turnout is historically lower than presidential turnout, and it is often skewed toward older, more partisan voters. Forecasters in 2026 are closely watching early voting numbers and mail-in ballot requests to gauge whether the "enthusiasm gap" favors one side. If a model assumes a standard midterm turnout but the actual electorate looks more like a high-turnout presidential year, the forecast will likely be off, particularly in states with high populations of young or transient voters.
Stay Updated with Our Site and Quick Links
To use election forecasting effectively, it is important to treat it as a weather report rather than a certain prophecy. A 20% chance of an upset is not a 0% chance; it means that in one out of five simulations, the underdog wins. As we move through the final days of the 2026 cycle, look for models that are transparent about their methodology and that provide frequent updates as new data arrives. Pay attention to the "uncertainty interval"—the range of seats a party might win—rather than just the single average number.
Practical steps for the final week include monitoring the "Generic Ballot" averages and checking for late-breaking non-partisan polls in key states like Michigan and Arizona. For those interested in the underlying mechanics of governance and representation, the Federal Election Commission provides real-time data on campaign finance, which is often a leading indicator of a campaign's organizational strength. Understanding these metrics allows for a more disciplined approach to civic engagement, moving past the emotional volatility of the news cycle.
At Infovotantes, our goal is to provide the clarity needed for informed civic participation. By breaking down the complexities of election cycle forecasting, we aim to help you navigate the 2026 midterms with a focus on data and structural reality. Clear information design is the foundation of a healthy democracy, and Infovotantes remains committed to presenting political data in a way that prioritizes understanding over persuasion.